
iOS Tutorial – Dumping the Application Heap from Memory
An essential part of pentesting iOS applications is analyzing the runtime of the application. In this blog, I will be covering how to dump the heap from an iOS application. I will also be releasing a little script to run on the iOS device to dump the heap of a specified application for you.
You can download the script from the NetSPI Git Hub. The script basically wraps around GDB, but only dumps the ranges in memory that have “sub-regions”. These sub-regions are usually where I find active credentials, anything that is currently being used in the UI, or instantiated class properties. This technique currently only works for iOS 7 and lower or until there is a working GDB version for iOS 8. You also cannot use the version GDB from the default Cydia repositories. You have to use the fixed version in this repository here: “https://cydia.radare.org” or here is a direct link to the deb package: “https://cydia.radare.org/debs/gdb_1708_iphoneos-arm.deb“. Below are a few screenshots of the process, and how the script works.
First, we launch the application that we want to capture the heap for and log in.
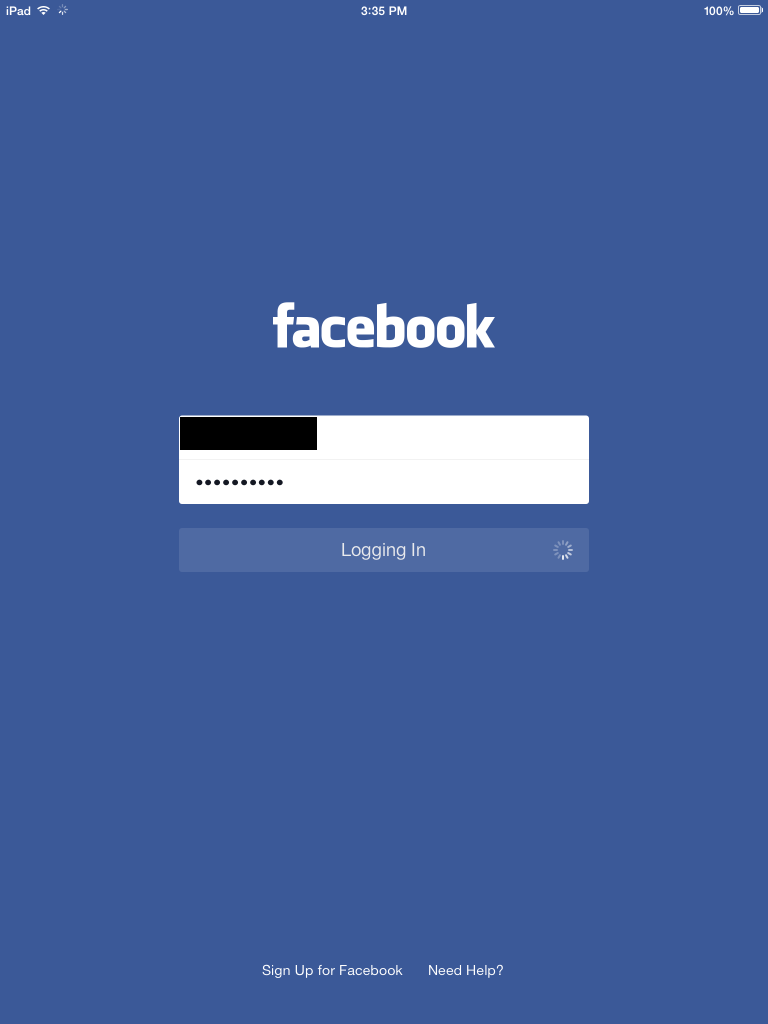
After we log into the app, we will keep it at the first main screen which in this case is the user’s timeline.
Now we will SSH into the device, so that we can leave the application running without the app being put in the background by iOS.
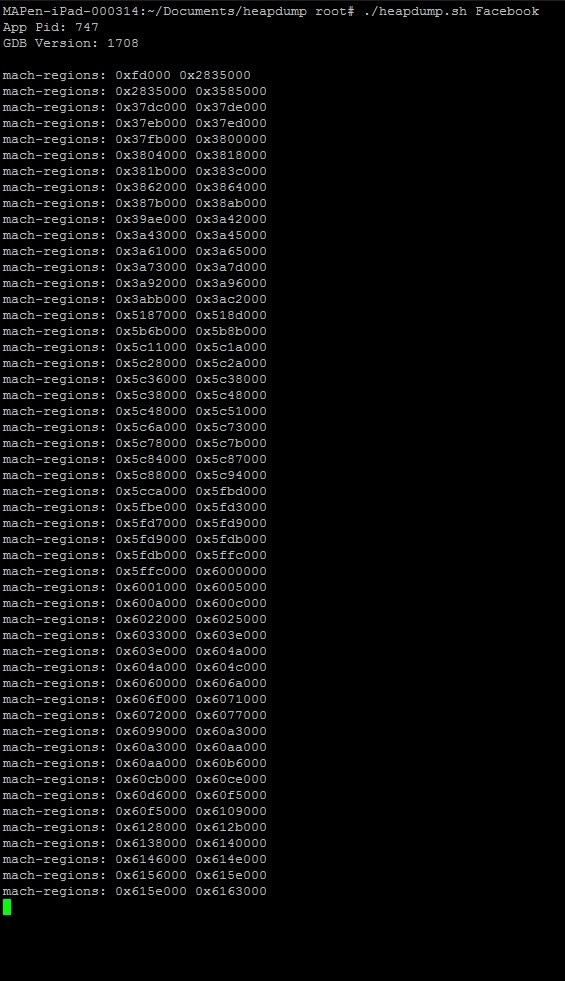
Above is the output that the script provides during runtime. Here we are giving the binary name that we want the script to dump.
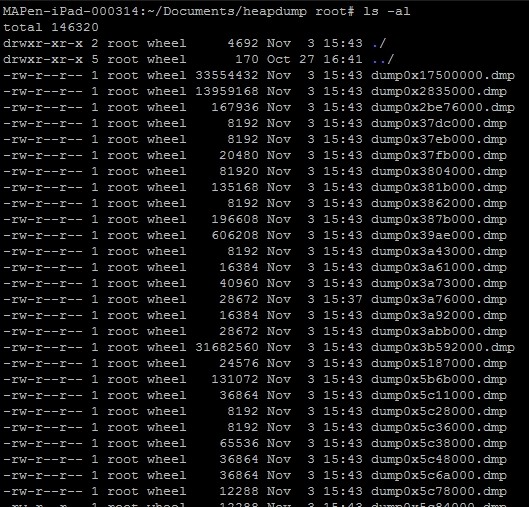
Above are all the .dmp files that we can now start searching through for the credentials or any other sensitive data. You can usually find encryption keys or passwords from any instantiated classes that use encryption or contain the login process. I personally use a combination of the “strings” command and “xxd” as a hex dumper but you can use any hex editor that works for you.
This technique can be used to determine if the application is not removing sensitive information from memory once the instantiated classes are done with the data. All applications should deallocate spaces in memory that deal with classes and methods that were used to handle sensitive information, otherwise you run the risk of the information sitting available in memory for an attacker to see.
I’ve included the GDB commands that are used in the script:
- gdb –pid=”<PID>”
- info mach-regions (look for sub-regions)
- dump binary memory heap1.dmp <sub-region range from above>
Explore more blog posts

Navigating Cybersecurity Regulations Across Financial Services
Learn about five areas businesses should consider to help navigate cybersecurity regulations, such as the Digital Operations Resiliency Act (DORA).

A New Era of Proactive Security Begins: The Evolution of NetSPI
Introducing The NetSPI Platform, the proactive security solution used to discover, prioritize, and remediate the most important security vulnerabilities. Plus, get a first look at NetSPI’s updated brand!

Penetration Testing: What is it?
Learn about 15 types of penetration testing, how pentesting is done, and how to choose a penetration testing company.